What Will a Hispanic United States Look Like? Part 2
Benjamin VillaroelPart 2 of 3 (Part 1 here, Part 3 here)
SALVADORANS
Percent of American Hispanics: 3.9
Today, Salvadorans make up almost as much of America’s Hispanic population as Cubans, but given their differing fertility levels (more on that below), they will almost certainly surpass Cubans inside of a generation. According to the CIA World Factbook, its demographic profile is 86.3 percent mestizo, 12.7 percent white, and 0.2 percent Amerindian. The World Population Review has almost exactly the same numbers, with whites at 12 percent and the mixed population at 88 percent. The latter publication notes that, like Mexico, El Salvador is “without a visible African population due to racial intermixing during its colonial days.” Unlike Mexico, however, El Salvador has almost no pure Amerindian population, meaning said population was miscegenated into the general mixed population. All of this suggests that the super-majority mestizo population is more Amerindian than white, and that there is a fair amount of dark mestizos (I would estimate about two-thirds of them). That, coupled with the presence of black genes, gives them a profile similar to that of southern Mexican mestizos. This is speculative, however, as there do not appear to be any genetic studies of Salvadorans, aside from one which did not take separate averages for its white fifth and mestizo majority, making it of no use.
Some readers may be surprised at how large the white population of this country is: 12.7 percent white. To belabor a point, the majority of them are almost certainly castizos: 75 percent white or more, not “whites” in the American sense. However, these is also assuredly a piece of the population that is entirely white – as is the case in most of Latin America.
Ana Villafañe, a white Salvadoran actress:
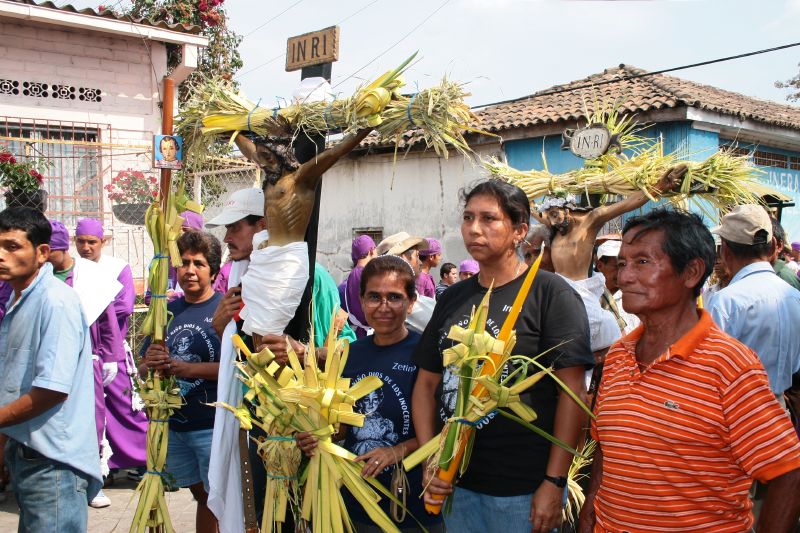
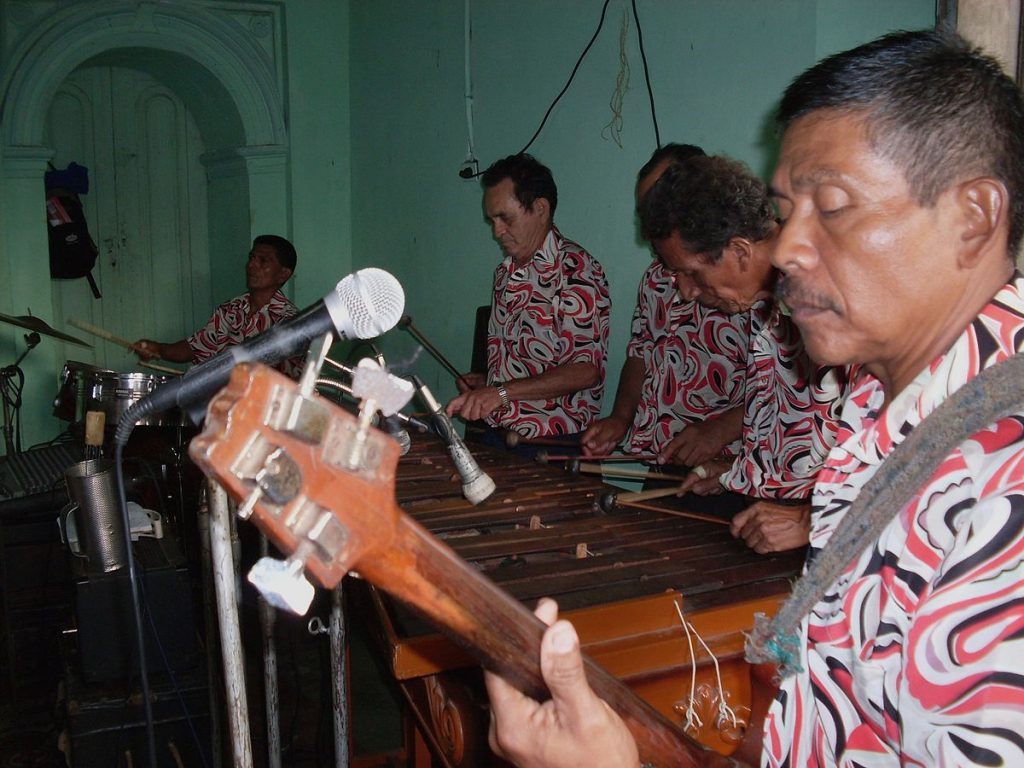
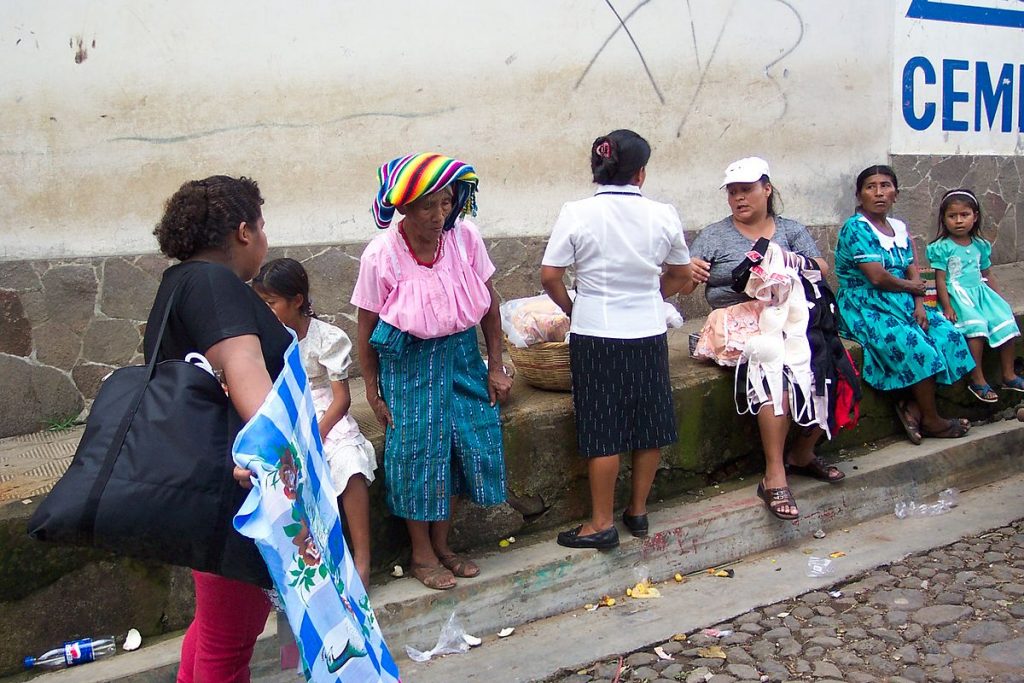
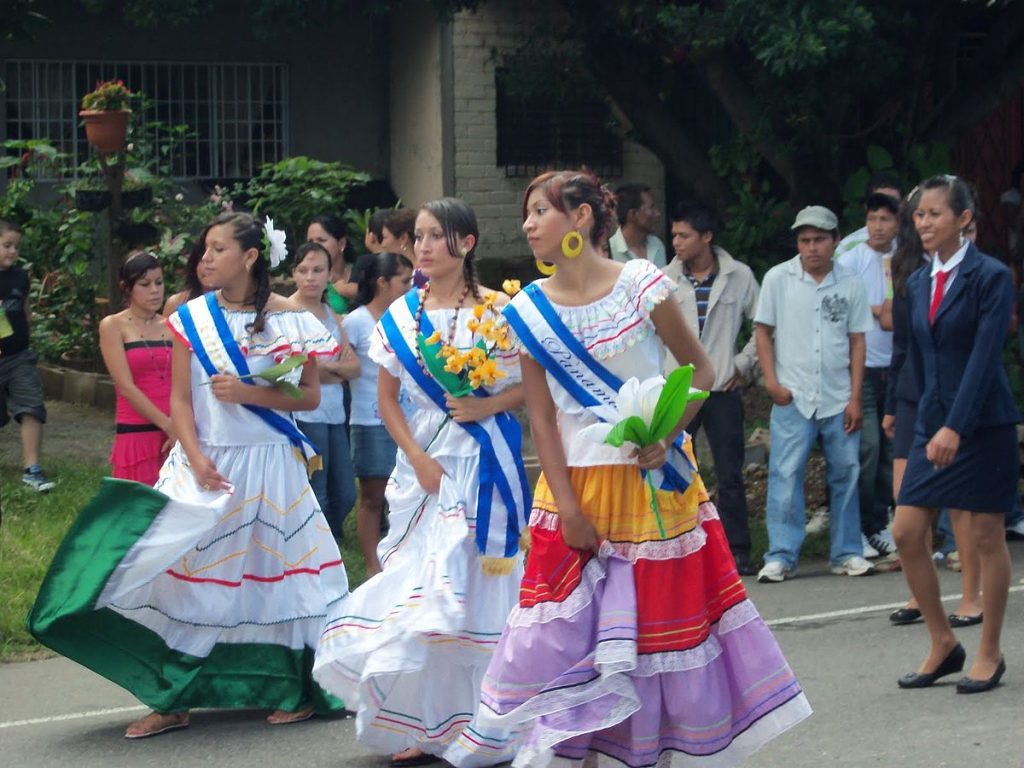
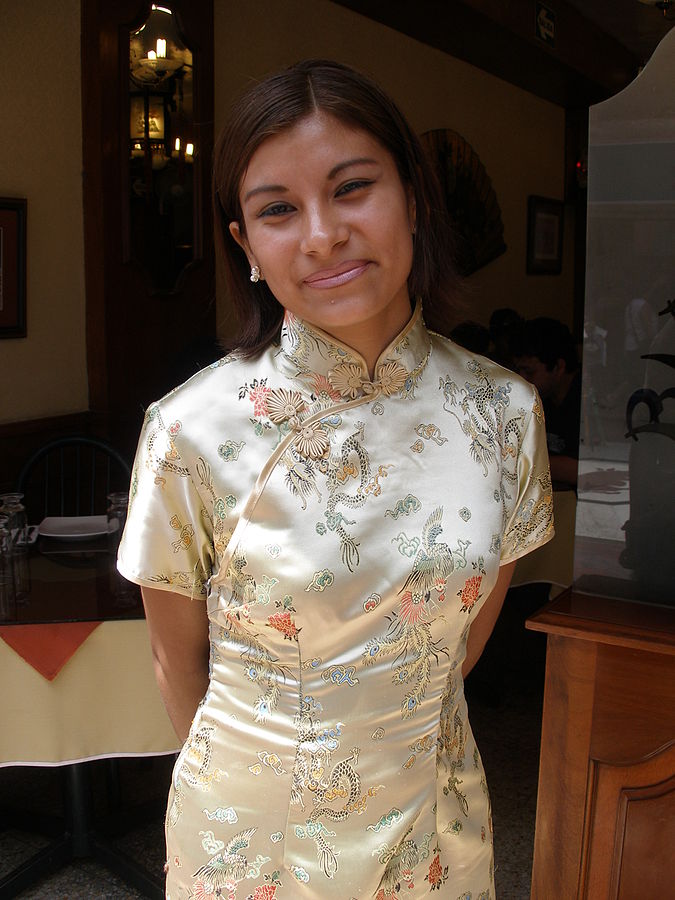
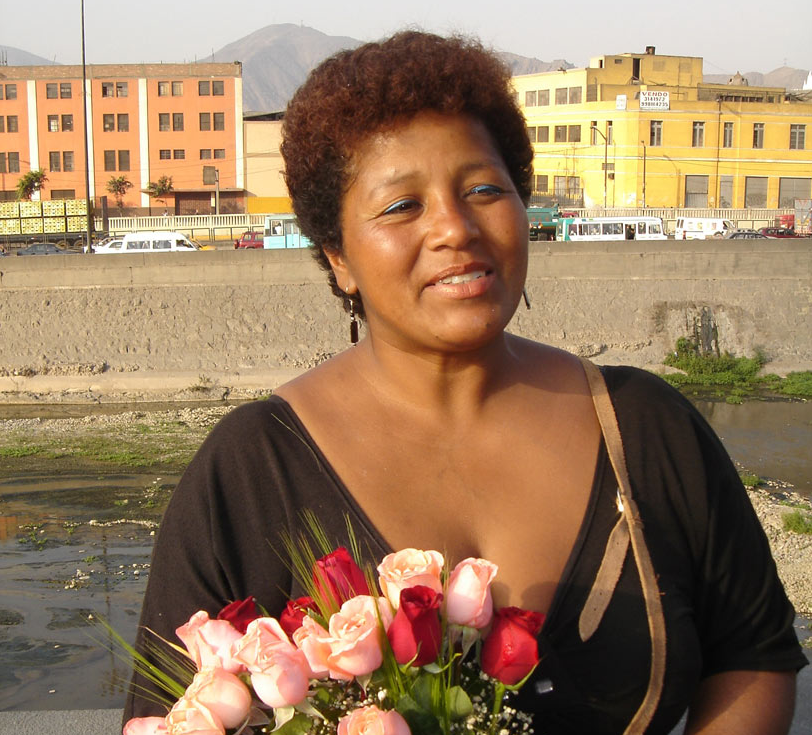
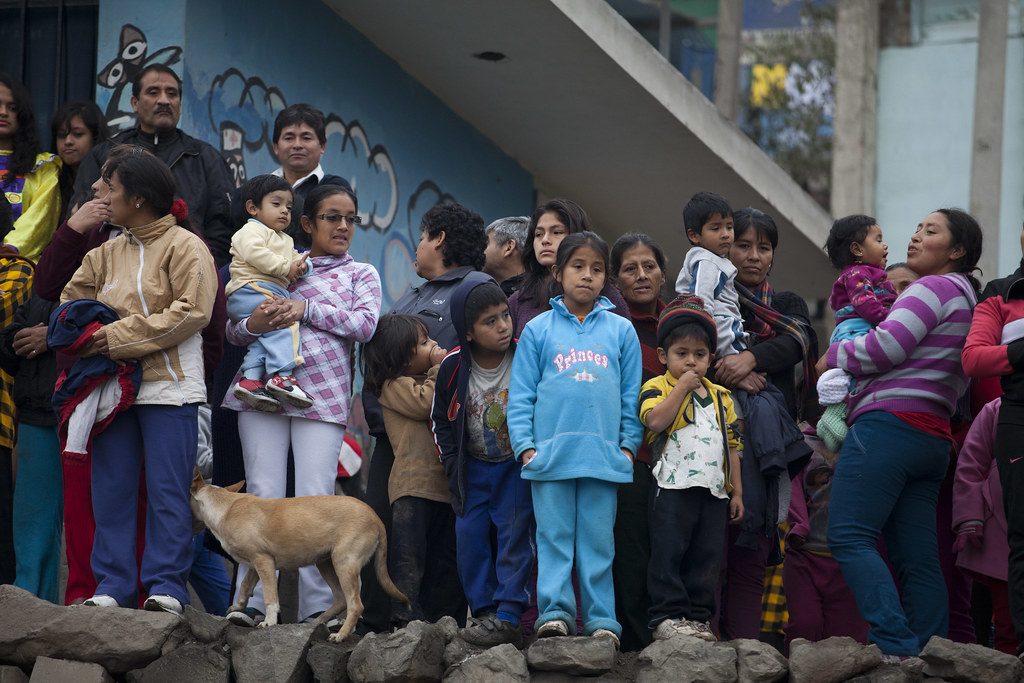
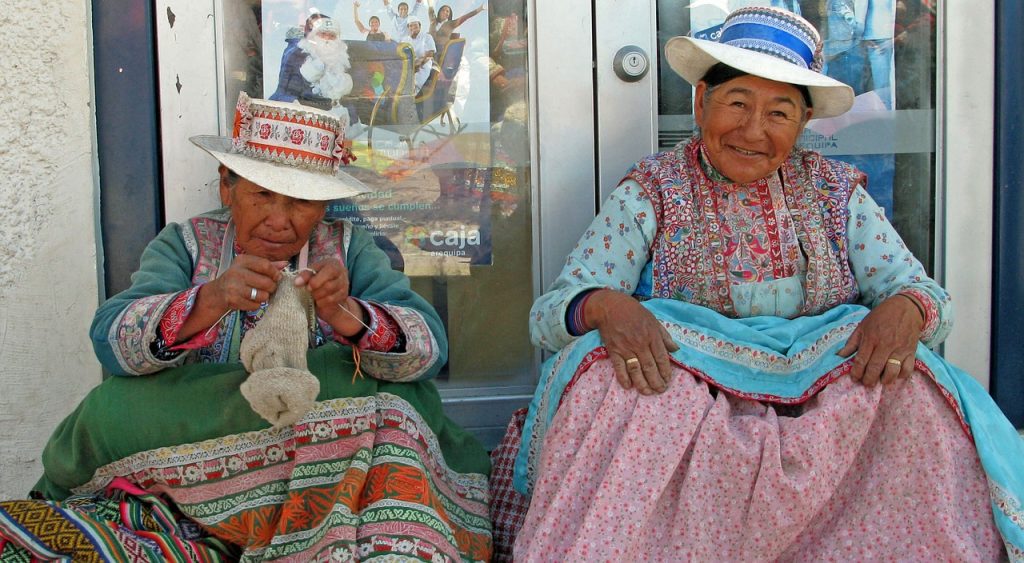
Below are photos of more common Salvadorans. Note how much less European their pallor and features are compared to the harnizos and castizos of Mexico.
By splitting the difference between the CIA and the World Population Review, and assuming that around two-thirds of those “mixed” are “dark mestizos,” yy demographic breakdown for El Salvador is:
~58.43 dark mestizo and Amerindian
~29.216 mestizo
~12.35 percent castizo, espomolo, and white
Given the fairly small size of El Salvador, I suspect Salvadoran immigration to the United States is fairly proportional to its demographics, with only whites being underrepresented.
DOMINICANS
Percent of American Hispanics: 3.5
The Dominican Republic (DR) has a very unique demographic makeup. Perhaps this is unsurprising given its geography: it shares the island of Hispañola with the black nation of Haiti, and said island is about equidistant from Puerto Rico, Cuba, and Jamaica – another black nation. Its profile in the World Population Review and the World Atlas are nearly identical: both put the white population at 16 percent and the black population at 11 percent. The only difference is that the Population Review places the “mixed” population at 73 percent, while the World Atlas places it as 72 percent, with another 1 percent being “other.” The CIA World Factbook gives a more nuanced layout, putting blacks at 15.8 percent, whites at 13.5 percent, and 0.3 percent as “other.” Per the CIA, the “mixed” population is 70.4 percent –but it subdivides that group into two categories: mulattos at 12.4 percent and “mestizo/indio” at 58 percent.
As with Cuba, since there is no pure Amerindian population (even if we assume “other” means pure Amerindian, they are no more than 1 percent of the population), the so-called “mestizo” population is likely to be more of a black and white mix than a white and Amerindian one. This misclassification is, again, likely attributable to the polite impulse of not wanting to designate people as black or “Afro-descended.” Said impulse is especially strong in the DA because they seek to differentiate themselves from their almost exclusively black neighbor, Haiti, a nation Dominicans both despise and look down upon.[1]
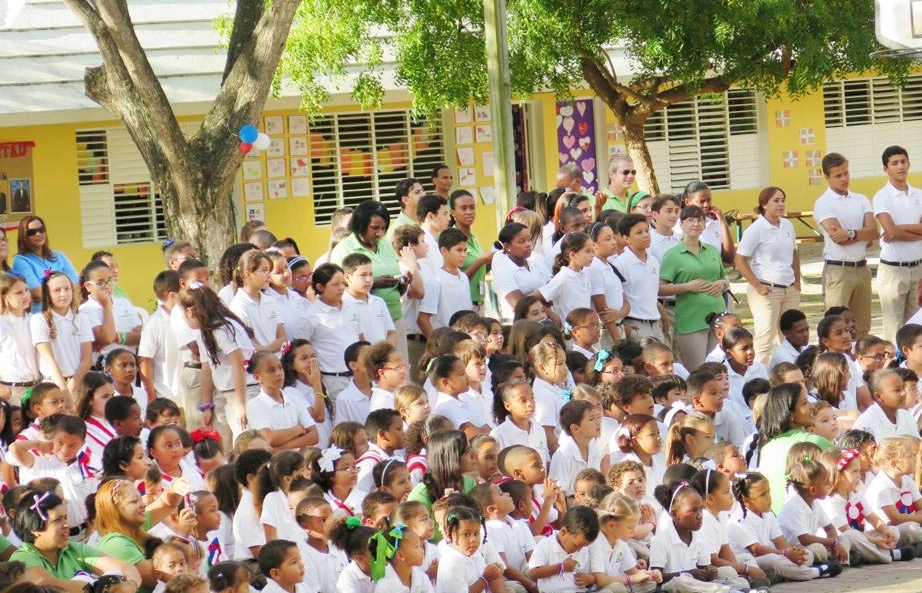
Various mixed Dominicans:
Monica Angulo, a white Dominican:
The World Population Review notes that, “Genealogical testing in 2012 found the average Dominican is 58% European, 35% Sub-Saharan African and 7% Asian-Native American.” Another study in 2015 said that the average Dominican was 52 percent white, 40 percent black, and 8 percent Amerindian-Taino.” Still another study broke down Dominican genes as 49 percent black, 39 percent white, and 4 percent Amerindian. If you average out these three studies, the genetic profile is 49.6 percent white, 41.3 percent black, and 6.3 percent Amerindian. Hence, the “mixed” or “mestizo” population of the DA is more or less the same as American mulattos. This makes the DA a mulatto nation, with between one-seventh and one-eighth of the population being majority white, and another one-seventh to one-eighth being majority black. Dominicans, then, are like much blacker versions of Cubans or Puerto Ricans. Dominican immigration to the United States seems to be about proportional to this demographic breakdown. In taking the average of our three demographic breakdowns, with the understanding that the population between white and black is mulatto, not mestizo, we arrive at a racial portrait of:
~72.234 percent mulatto
~15.166 percent white
~12.600 percent black
Fertility & Future Migration Patterns
The remaining Hispanic populations that we will examine constitute a much smaller portion of Hispanic America than those above; all of the below are 2.5 percent of American Hispanics or less. While this may seem small, there is still great value in taking a look at them because in the future, these ratios could easily change. While of course geographical proximity to the US plays a large role in determining who immigrates here, so too does the political situation of a given nation. For example, America’s Venezuelan population arrived almost entirely as a consequence of that country’s monstrous Marxist reign, which came to power in 1999. Between 1970 and 1990, around one million Chileans (a tenth of the country) left their home (landing all over the world) either to escape its socialist government, or the subsequent Right-wing government that violently displaced it. So, if Ecuador succumbs to a Communist regime, Ecuadorian immigration to the US will shoot up dramatically. If a civil war breaks out in Honduras, Honduran immigration to America will rise, and so on and so forth. Since much of Latin America is perpetually on the brink of war and autocracy, these are very real possibilities. And since this study is to help give us a sense of the racial composition of America several decades from now, looking at what are today minor immigrant groups may well prove essential for creating an accurate portrait of our future racial mosaic.
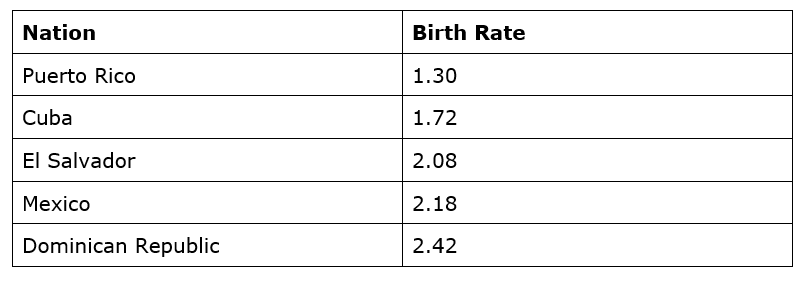
Furthermore, the birth rates of Latin America vary much more than you might think, and many of the nations with the highest levels of immigration to America are also those with low – or at least relatively low – birth rates. Below is a table of the birth rates of each of the nations examined above. The data is from the World Bank for the year 2016 – and remember that “replacement level fertility” is 2.10. For reference, the US has a rate of 1.80.
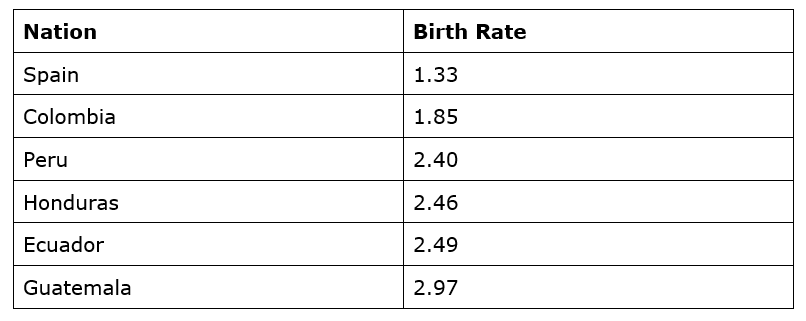
Here are the fertility rates of the next six countries we will look at.
Three of these nations are more fertile than any of those in the first table – and two of those nations (Guatemala and Honduras) are quite geographically close to the US.
GUATEMALANS
Percent of American Hispanics: 2.5
Though today Guatemalans are only 2.5 percent of America’s Hispanic population, as we can see above, given their high birth rates, we can expect their share to rise in coming decades. The CIA World Factbook breaks down this nation’s demographics in a curious way, lumping whites and mestizos together in one block, said to be at 60.1 percent. Pure Maya Amerindians are put at 39.3 percent. The remaining population is divided into an unexplained “other” at 0.5 percent, and a 0.15 percent composed of another curious mix: both pure Amerindians specifically of the Xinca tribe, and “Garifuna,” a hybrid of certain non-Maya Amerindian tribes and blacks. Why these Garifuna, a very small percentage of the population, are separated into their own category is not immediately obvious to me – especially since they are present in even greater numbers elsewhere in Central America, where they are not counted separately from the Amerindian/mestizo populations. This serves as yet another example of how the genetic complexities of Latin America can be measured in a number of different, and somewhat subjective, ways.
The World Atlas and the World Population Review paint much clearer demographic pictures. The average of their two very similar breakdowns is:
41.5 percent mestizo
39.5 percent Amerindian
18.25 percent white
0.75 percent other
Given that the CIA puts the Maya population at 39.3, it is safe to say that the super-majority of Guatemalan Amerindians are Maya, with some admixture from other tribes.
Genetically, they are something of a cross between Mexicans and Salvadorans. This should come as no surprise, since geographically, they are literally between Mexico and El Salvador. One study places the Maya average as 92 percent Amerindian and 8 percent white. The Amerindian population seems to have little to no black admixture, seemingly almost exclusively from the small population of Garifunas. The mestizos, meanwhile, are on average 55 percent Amerindian and 41 percent white – and the final 4 percent is black. The IAELAP supports this finding, with their one study of the country (its eastern half) averaging 40 percent white, 7 percent black, and 55 percent Amerindian. This would mean that the mestizos of Guatemala trend towards being dark mestizos, though given the existence of the sizeable separate Amerindian populations, I am sure there are mestizos as well.
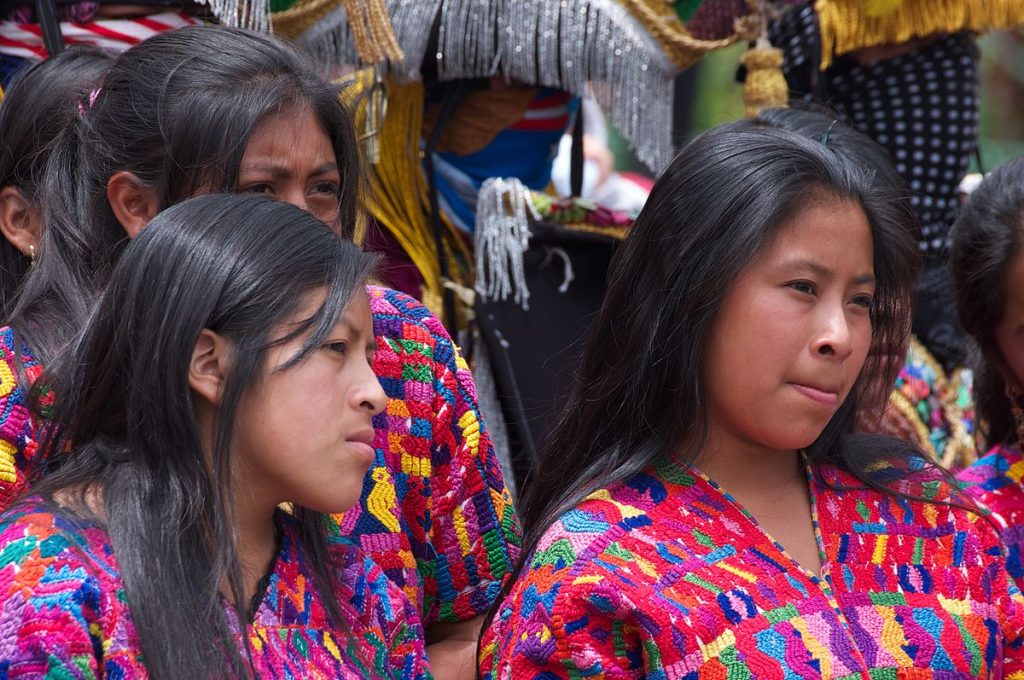
Guatemalan Mayan women:
A Guatemalan mestizo and dark mestizo with an American soldier:
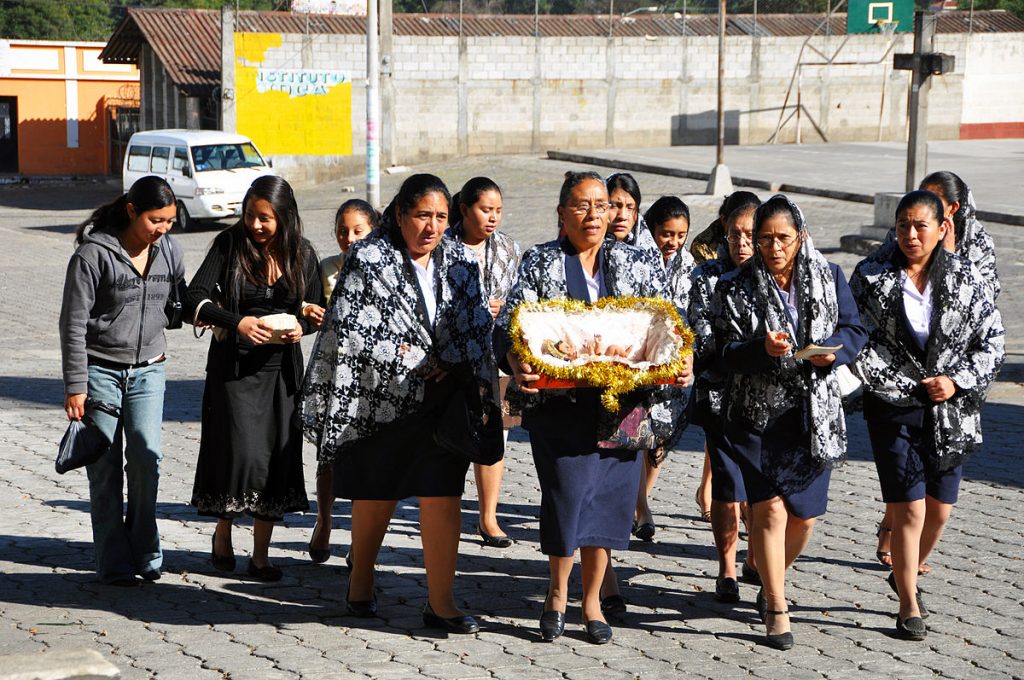
A mixed group of Guatemalan women:
It is safe to assume that the whites of Guatemala are a mix of castizos, espomolos, and pure whites, as is the case in the rest of Latin America.
Rafael Mejicano Díaz:
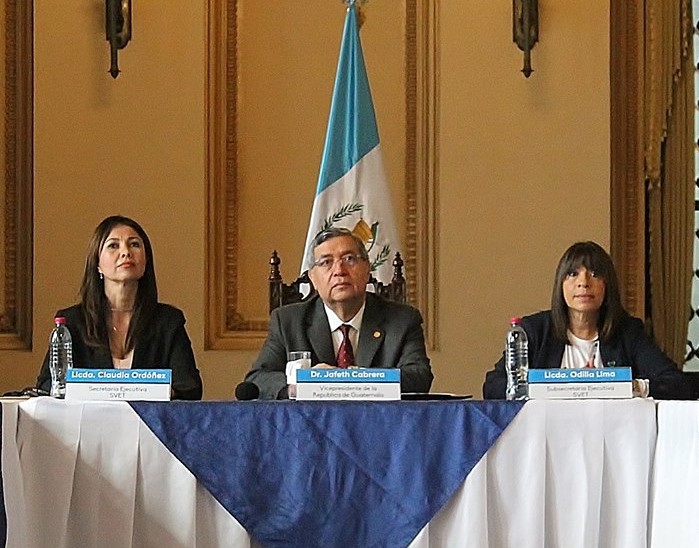
White and whitish Guatemalans:
Demographically, then, we could roughly break down Guatemala as being:
~39.5 percent Amerindian, almost entirely Maya
~27.6 percent dark mestizo
~18.25 percent castizo, espomolo, and white
~13.83 mestizo
~0.75 percent other
As with El Salvador, given the small size of the country, I suspect the racial breakdown of Guatemalan immigrants is fairly proportional to the demographics of the nation as a whole.
COLOMBIANS
Percent of American Hispanics: 2.1
As with Guatemala, the CIA World Factbook lumps together Colombia’s white and mestizo populations, putting the undifferentiated total at 84.2 percent. “Afro-Colombians” are placed at 10.4 percent, and Amerindians at 3.4 percent. Both the World Atlas and the World Population Review separate whites from mestizos, but their breakdowns are quite different. World Atlas claims:
53.5 percent mestizo
30.7 percent white
10.5 percent black-ancestry
3.4 percent Amerindian
1.9 percent other
Meanwhile, the World Population Review claims:
49 percent mestizo
37 percent white
11 percent black
3.4 percent Amerindian
Where all three surveys concur is in the Amerindian and black populations; all three place blacks at between 10 and 11 percent, and all three place the Amerindian population at 3.4 percent.
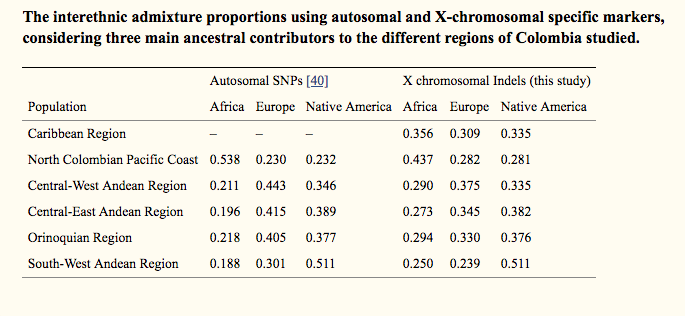
The variation in breakdown between whites and mestizos suggests that the population is quite varied, or as the IAELAP dryly observed, “for Colombia, high interpopulation variability is observed.” Part of this variation is simply a function of geography. In Latin America, the bigger the country, the more varieties of miscegenation there can be, while in smaller countries, one or two genotypes can more easily become dominant. For instance, Guatemala, El Salvador, and Cuba are all under 50,000 square miles total. Brazil, one of the most miscegenated countries on Earth, is well over three million square miles. Mexico is about three-quarters of a million, and Colombia is about 400,000. The IAELAP breakdown genetic samples in two different ways, shown here.
And (from the same paper):
Another genetic study I was able to find also found it necessary to segment Colombia into a number of different areas as well (see bottom of page 17 here).
In the above table, all the samples are geographic aside from one (the very bottom row), taken specifically from blacks of one area. If we take that sample out of this mix, the Amerindian average ranges from 40 to 66 percent, while the white average is from 30 to 50 percent. The black average does vary immensely. Of the 15 areas, three have an average percent of black ancestry measured in the double digits. Three have an average of zero. The remaining nine are between 1 and 5 percent – except for one outlier that sits at 9 percent black.
The IAELAP’s simpler table (the middle of the three above), broken down by simple nautical regions, paints a similar picture. Aside from the blackest region (north Pacific coast), Amerindian ancestry ranges from 34.6 percent to 51.1 percent. White ancestry ranges from 30.1 percent to 44.3 percent – again, whites never top an average of 50 percent, as is the case in parts of northern Mexico.
However, in looking at the IAELAP’s most area-specific table, the genetic layout comes off as much more nuanced. Instead of states, Colombia has what are called “departments,” and one does stand out as particularly white, so long as the samples exclude blacks and mestizos. Named Antioquia, it is the third most populous department, and its capital, Medellín, is the second largest city in the country. Three of the four studies of that department put the average range of white ancestry at between 60 and 79 percent, with the non-white portion being majority Amerindian, making its inhabitants largely a mix of harnizos and castizos – not unlike northern Mexico. Medellín alone ranged from 60 to 66 percent white, with the non-white portion again being much more Amerindian than black. Medellín, then, is perhaps something of a harnizo city, or at least has a large number of harnizos and castizos in addition to mestizos.
While no other departments show an average of white ancestry surpassing 50 percent, two cities do: Armenia, the capital of the Quindo department, at 57 percent white; and Bucaramanga, the capital of the Santander department, at 56 percent white.
But even if we eliminate these majority-white departments and cities, along with the mestizo and black ones, the range for everywhere else is still so wide that it would be hard to claim a meaningful average. Some places appear to be pardo, a fairly even mix of white, black, and Amerindian. Others are considerably more white than anything else, but still not white enough for the area to be accurately labeled white. Still others are akin to dark mestizo – but with much more black ancestry than anywhere else we have looked at.
Though this wide variety of mixes makes analyzing Colombia a daunting task, it would still appear to be safe to say that the claims of 30 to 37 percent of the population being white are not accurate. Even with the understanding that most of those whites will have some 25 percent black and Amerindian admixture, there are just too few regions in the country with majority white averages for the 30 to 37 percent white estimate to make sense. Mexico, with its 10 percent white and 20 percent harnizo populations, has many regions where the average percent of white ancestry is over 50 percent. Moreover, aside from those in the Caribbean, every other country in this region that we have looked at has a white population of no more than 20 percent. Moreover, countries without large pure Amerindian populations generally do not have them precisely because there was so much mixing – this is why Salvadorans look (and are) so much less white than Mexicans. Given all of that, plus the genetic studies above, I am inclined to believe that Colombia’s castizo-white population is somewhere between 15 and 20 percent, not somewhere between 30 and 40 percent. This would make Colombia around:
~3.4 percent Amerindian
~10.5 percent black
~17.5 percent castizo, espomolo, and white
The remaining 68.6 percent of Colombia does not give the impression of being entirely mestizo, but a mix of mestizo, harnizo, pardo, and dark mestizo. What percent of the nation each those four groups represents is impossible to say with any kind of certainty, given the studies and demographics available.
HONDURANS
Percent of Hispanic Americans: 1.6
Like Guatemalans, today Hondurans are not a large portion of Hispanic Americans, but their birthrates suggest their portion will grow. The CIA World Factbook and the World Population Review are in almost perfect agreement regarding the demographics of Honduras. Both claim:
90 percent mestizo
7 percent Amerindian
2 percent black
However, the CIA lists a white population of 1 percent, while the World Population Review does not, leaving their population total at 99 percent. There appear to be no readily available genetic studies of Honduras. I would estimate, however, that its mestizo super-majority is about half mestizo and half dark mestizo. This assumption comes from the fact that it has such a small Amerindian population, and a negligible white population – suggesting that much of both were absorbed into the mixed population. Furthermore, while two of its neighbors, Guatemala and El Salvador, have more dark mestizos than mestizos, its southern neighbor, Nicaragua, is understood to be considerably whiter than every nation in Central America to its north.[2] Honduras, then, is likely a cross between the three:
~45 percent mestizo
~45 percent dark mestizo
~7 percent Amerindian
~2 percent black
~1 percent castizo, espomolo, and white
So, although Honduras has a much smaller white population than Guatemala and El Salvador, its non-whites are whiter. This strikes me as apparent in looking at photos of Hondurans:
SPANIARDS
Percent of Hispanic Americans: 1.4
Spaniards, though certainly darker than Scandinavians, Anglos, and Germans, are white Europeans. Let us hope that Spain shuts its doors to the ever-growing number of Arabs and black Africans that wish to pour into Europe by any means.
Africans hits the beaches of Spain (embed):
If Spain does not do this, in the future, Spaniard immigration may start to look a lot like Moroccan immigration. The one other thing worth noting is that “Spaniard” denotes someone from the polity of Spain. “Spanish” is largely just a self-identifier term that means “of Spanish ancestry,” regardless of the polity that person was born in or comes from. Because of this, “Spanish” is a largely meaningless and much abused term.
Felipe VI:
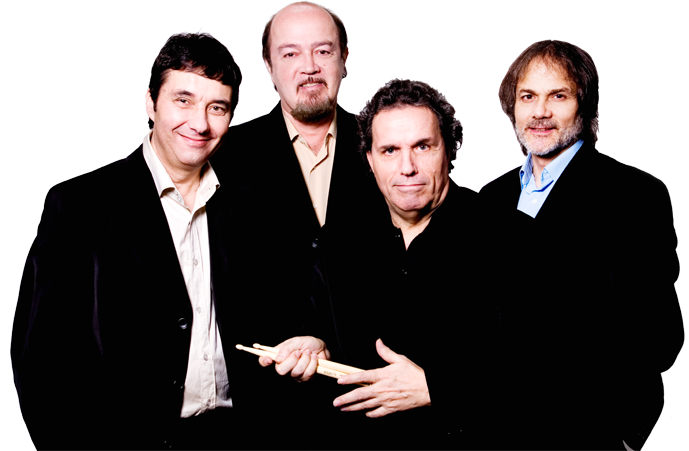
Spanish classic rock group, Los Brincos:
ECUADORIANS
Percent of Hispanic Americans: 1.2
The CIA World Factbook breaks down Ecuadorian demographics as:
71.9 percent mestizo
7.4 percent Montubio
7 percent Amerindian
6.1 percent white
4.3 percent Afro-Ecuadorian
1.9 percent mulatto
1 percent black
0.4 percent other
The Montubio people are simply a tribe-specific variety of mestizos. Since mulatto and black each have their own category, “Afro-Ecuadorian” means “of a perceptible amount of black that is less than 50 percent.” The World Atlas, otherwise largely in agreement with the CIA’s demographic breakdown, puts the blacks and mulattoes together with the “Afro-Ecuadorians,” for a total of 7 percent. A simpler demographic portrait of the country, then, would be:
79.3 percent mestizo
7 percent Afro-Ecuadorian
7 percent Amerindian
6.1 percent white
0.6 percent other
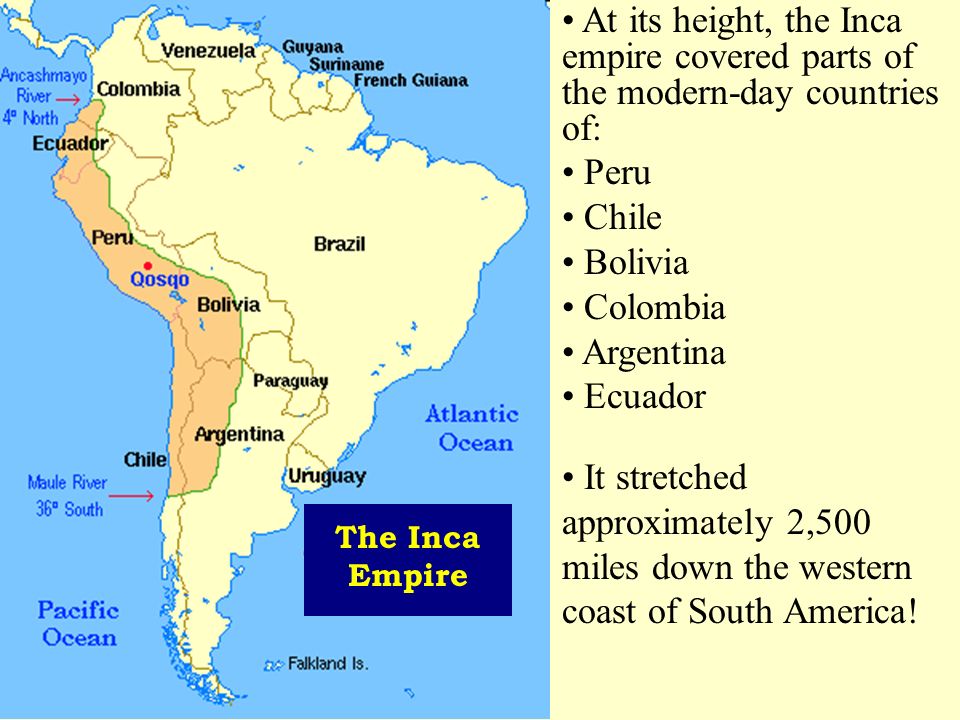
Despite the relatively small populations of whites and Amerindians, the mestizos of Ecuador are largely dark mestizos. This is because the borders of Ecuador today fall almost entirely within the confines of the former Amerindian Inca Empire.
Map of Inca Empire:
The IAELAP surveyed Ecuadorian mestizos and found an average ancestry of 19 percent white, 8 percent black, and 73 percent Amerindian. The number of mestizos with 50 percent or slightly more white ancestry, then, is likely to be quite small, probably no more than one in eight. The demographics of Ecuador would then be around:
~69.3 percent dark mestizo
~10 percent mestizo
~7 percent Afro-Ecuadorian
~7 percent Amerindian
~6.1 percent castizo, espomolo, and white
~0.6 percent other
This would make Ecuador, arguably, the least white nation we have looked at so far.
Afro-Ecuadorians:
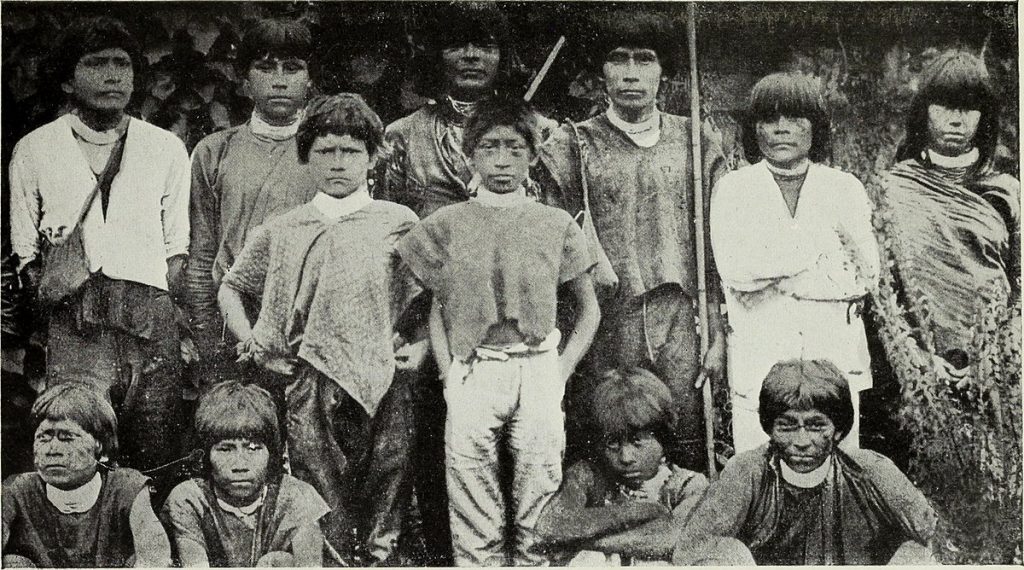
Ecuadorian Amerindians:
Ecuadorian mestizos:
Ecuadorian dark mestizos:
PERUVIANS
Percent of Hispanic Americans: 1.2
Just as central Mexico is the home of the former Amerindian Aztec Empire, and southern Mexico and Guatemala are the home of the former Amerindian Maya Empire, so Peru is the home of the former Amerindian Inca Empire. The CIA World Factbook breaks down Peru’s demographics as:
60.2 percent mestizo
25.8 percent Amerindian
5.9 percent white
3.6 percent of African descent
1.2 percent “other” (which includes Peru’s small east Asian population)
3.3 percent unspecified
One poll that asked Peruvians to self-identify with one racial category come up with a similar breakdown, but with the Amerindians identifying by specific tribe:
59.5 percent mestizo
22.7 percent Quechua
6.7 percent other
4.9 percent black or mulatto
4.9 percent white
2.7 percent Aymara
1.8 percent Amazonian
All the Amerindian tribes put together (Quechua – which means Inca and similar tribes, Aymara, Amazonian) total 27.2 percent, nearly identical to the Amerindian total per the CIA. The large “other” is likely made up of even smaller Amerindian tribes, East Asians, and people who insisted on specific racial labels such as castizo or quadroon. Regardless, the demographic profile of Peru put out by the World Atlas is another example of how racial ambiguity in Latin America can lead to deceptive statistics. They claim Peru to be:
45 percent Amerindian
37 percent mestizo
15 percent white
3 percent Asian, African, and/or other
Here, relative to the other two sets of data, the Amerindian and white populations have gone up dramatically, while the mestizo and black populations have plummeted. Cutting the demographic pie this way could be easily done by taking the whiter mestizos and classifying them as white, and then taking the darker mestizos and those of African ancestry with apparent Amerindian ancestry, and placing both groups into the pure Amerindian category. As the genetic surveys we have looked at for other countries show, Latin America is a very mixed place – and where one draws the lines for categorization is not always obvious.
Both from the genetic research that has been done, and from my own time in the country, it is clear that Peru, like Ecuador, is not very white. In surveying multiple different regions, the highest white average the IAELAP found was only 31 percent. The vast majority of the regions averaged Amerindian ancestry between 80 and 95 percent (see this table).
Another study ended in similar results, with even the same two geographic outliers for highest amounts of white ancestry: San Marcos and Characato.
Peru’s “mestizos” are then made up of even more dark mestizos than are the “mestizos” of Ecuador. Indeed, I doubt that there is a statistically significant number of mestizos that are not really “dark mestizos.” Peru is therefore even less white than Ecuador. In splitting the difference between the sources above, aside from the suspicious World Atlas numbers, Peru’s racial breakdown would be:
~59.85 percent dark mestizo
~27.9 percent Amerindian
~5.40 percent castizo, espomolo, and white
~4.25 percent black and mulatto
~2.60 percent “other” or unspecified (including Peru’s small east Asian population)
A half-Chinese, half-dark mestizo Peruvian:
Afro-Peruvian:
Amerindian and dark mestizo Peruvians:
Notes
[1] The DA was a part of Haiti from Haitian Independence in 1804 until 1844, when Dominicans began their own revolt for independence, ultimately winning it in 1856. Relations between the two countries have never been good, to say the least.
[2] The IAELAP, for example, lists the average genetic composition of Nicaraguans as 69 percent white, 20 percent black, and 11 percent Amerindian.
What%20Will%20a%20Hispanic%20United%20States%20Look%20Like%3F%20Part%202
Share
Enjoyed this article?
Be the first to leave a tip in the jar!
Related
-
Counter-Currents Radio Podcast No. 580: On Dealing with the Decline of the White World with Millennial Woes and Morgoth
-
Counter-Currents Radio Podcast No. 579: New Ask Me Anything with Millennial Woes
-
Renaud Camus on the Origins of the Demographic Disaster
-
The Phil Lynott Conundrum
-
The New European Union and Its Superstructure
-
Remigration: Alternative for Germany and a Path Toward a Self-Confident Germany Once Again
-
Foreign Policy, Non-Interventionism, and the Draft
-
Population Doom






2 comments
So depressing all around, but very informative and very much needed statistically. Great photos to illustrate the story as well — not all Hispanics or Latinos are the same! If we do not start organizing, we are sunk. I’m overseas in England for a couple weeks, and it is terrible here as well. Different bunch nesting here. We need help worldwide.
I’m so tired about hearing of culture and ugly American capitalism lately. Then people endlessly talk about the beauty of culture, the beauty in architecture, the beauty in nature etc etc. to contrast the McDonald’s arches and so on. Very deep and meaningful takes on our society…. ….
Yet nobody ever speaks about the beauty in people. Surely if a waterfall is the catcher of eyes or a Gothic chapel a sight to behold, people are also something impossible not to find beauty in? Soft eyes blue as an ocean, a pale freckled feminine curve of a woman’s back, or the dainty ladylike fingers of gentle girl. Blissful.
These people here in these pictures…I find it hard to see the beauty in them in anything but an inverted artistic way. I’m sure some of them are very kind and very humble but they are not us nor ever will be. No amount of culture or assimilation will ever change that.
Comments are closed.
If you have Paywall access,
simply login first to see your comment auto-approved.
Note on comments privacy & moderation
Your email is never published nor shared.
Comments are moderated. If you don't see your comment, please be patient. If approved, it will appear here soon. Do not post your comment a second time.